Project information
- Tools Used: Microsoft PowerBI, Canva and Microsoft Excel
- Interact: Dashboard
- Github : Repository and Documentation
- Dataset : Maven Analytics
- View all Power BI Visualisations : here
- View all Project Repositories: here
Project details
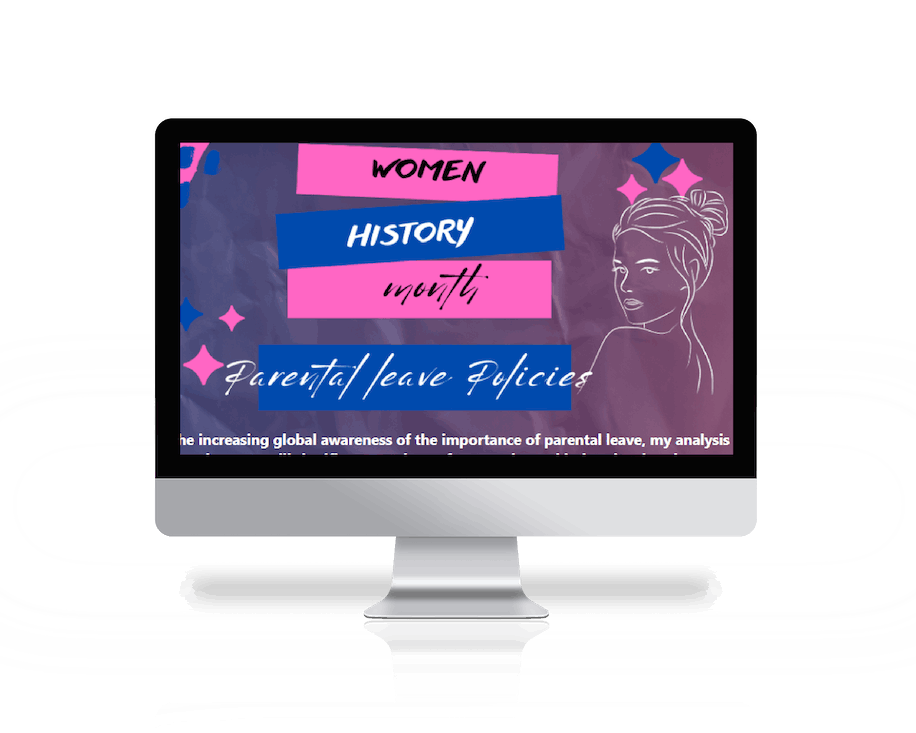
As part of Women's History Month, I analysed data on the % of paid and unpaid maternity/paternity leave and broke it down by company and industry. Check out my Visualisation created using PowerBI - it sheds light on how different companies are supporting working parents. Let's continue to push for more equitable policies and support for working families!

.png)
.png)